
Physics Lab Manual
- Physics 21: Mechanics
- Physics 22: Electromagnetism
- Physics 23: Waves, Thermodynamics, and Optics
- Physics 6: Mechanics and Waves
- Physics 7: Electromagnetism, Thermo, Optics
- Physics 8: Mechanics and Waves
- Physics 9: Electromagnetism, Thermo, Optics
- Physics 14: Conceptual Physics
Uniformly Accelerated Motion
The purpose of this lab is to investigate uniformly accelerated motion by using a dynamics track and cart with a "Smart Timer" ticker tape system.
Part A: Zero Net Force
Make sure the track is level and that the timer is as far to one end of the track as possible. At the other end a "track stop" should be firmly in place. Practice pushing a cart along the track with a firm push from the timer toward the other end of the track. The cart should take 2 or 3 seconds to reach the other end, moving fast enough that no slowing is noticeable to the eye, but not TOO fast.
Now measure and tear off a length of tape long enough to go from one end of the track to the other. Thread it through the slits on the top of the tape timer, with the tape on top of the blue carbon paper, but under the metal bar. Use masking tape to secure one end of the ticker tape to the cart. The rest of the ticker tape should be smoothly laid out on the other side of the timer.
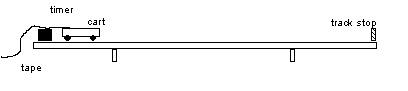
Turn the tape timer on at 10 Hz and give the cart a push as you practiced earlier. A team member should catch the cart at the far end when it hits the track stop. Inspect the bottom of the tape to see if the motion has been recorded. There should be at least 20 clearly marked dots. If so, mark that side "Part A" and with a pen or pencil circle the dots on the tape.
Part B: Net Force
Now use a wooden block to raise the end of the track with the tape timer about 25 cm off the table. Measure the height from the table of the 100 cm mark and the 200 cm mark so you can calculate the angle that the track makes with the table.
| 100 cm height | 200 cm height | Height difference | Track angle |
|---|---|---|---|
As in Part A, practice letting go of the cart from the raised end near the tape timer (and practice catching it at the bottom!). Once you are ready, tape the SAME piece of tape onto the cart after having threaded it through the timer, as in Part A EXCEPT make sure the tape is flipped over compared to before.
Turn on the timer to 10 Hz and release the cart. DO NOT PUSH IT! A team member should catch the cart at the far end just before it hits the track stop. Inspect the bottom of the tape to see if the motion has been recorded. There should be at least 20 clearly marked dots. If so, mark that side "Part B" and with a pen or pencil circle the dots on the tape.
Analysis
Part A - horizontal motion
How do you expect the spacing of the dots to look for this part of the lab? (Draw a motion diagram below.)
Label the dots 1, 2, 3... starting with the first dot that seems appropriate for the motion. Measure the TOTAL distance from the first dot to each of the other dots. Do NOT measure distances between successive dots. Record the times and positions of the dots in the table below. Also, calculate the change in position as shown in class (Dx2 = x3 - x1 etc...). Average velocity is just the change in position divided by the time taken (twice the time between dots = 0.2 s).
| Data Point | Time (s) | Position (cm) | Change in position | Average velocity |
|---|---|---|---|---|
| 1 | 0.0 | 0.0 | - | - |
| 2 | 0.1 | |||
| 3 | 0.2 | |||
| 4 | 0.3 | |||
| 5 | 0.4 | |||
| 6 | ||||
| 7 | ||||
| 8 | ||||
| 9 | ||||
| 10 | ||||
| 11 | ||||
| 12 | ||||
| 13 | ||||
| 14 | ||||
| 15 | ||||
| 16 | ||||
| 17 | ||||
| 18 | ||||
| 19 | ||||
| 20 |
Using the program "Graphical Analysis" enter the times and velocities into the data table.
Find the equation of the line by using the "analysis" tool called "automatic curve fit". Once you are satisfied with the fit, print out the graph of velocity against time, along with the equation of the line found by using the program.
What was the acceleration of the cart?
Why was it not zero?
Calculate an estimate for the net force acting on the cart (m = 0.50 kg).
Part B - Motion down the slope
How do you expect the spacing of the dots to look for this part of the lab? (Draw a motion diagram below.)
Draw a free body diagram for the cart on the slope below.
Calculate how much of the weight force (W = mg) is acting down the slope. (The mass of the car is 0.50 kg.)
Numerically, what should the acceleration of the cart be?
Label the dots 1, 2, 3... starting with the first dot that seems appropriate for the motion. Measure the TOTAL distance from the first dot to each of the other dots. Do NOT measure distances between successive dots. Record the times and positions of the dots in the table below. Also, calculate the change in position as shown in class (Dx2 = x3 - x1 etc...). Average velocity is just the change in position divided by the time taken (twice the time between dots = 0.2 s).
| Data Point | Time (s) | Position (cm) | Change in position | Average velocity |
|---|---|---|---|---|
| 1 | 0.0 | 0.0 | - | - |
| 2 | 0.1 | |||
| 3 | 0.2 | |||
| 4 | 0.3 | |||
| 5 | 0.4 | |||
| 6 | ||||
| 7 | ||||
| 8 | ||||
| 9 | ||||
| 10 | ||||
| 11 | ||||
| 12 | ||||
| 13 | ||||
| 14 | ||||
| 15 | ||||
| 16 | ||||
| 17 | ||||
| 18 | ||||
| 19 | ||||
| 20 |
Using the program "Graphical Analysis" enter the times and velocities into the data table.
Find the equation of the line by using the "analysis" tool called "automatic curve fit". Once you are satisfied with the fit, print out the graph of velocity against time, along with the equation of the line found by using the program. The slope of the velocity-time graph is the acceleration of the cart.
What is the experimental acceleration of the cart?
What is the percentage difference between the theoretical and experimental accelerations?
Discussion
Why was the graph of velocity against time for the horizontal track (Part A) not constant?
Discuss some reasons why in Part B the theoretical and experimental accelerations were different, and why your results are reasonable.